Make 4 graphs + Calculate 95% confidence intervals & % change
- Status: Closed
- Præmier: $25
- Modtagne indlæg: 12
- Vinder: Sadanm

Konkurrence Instruktioner
Hi, I have a very small set of data and I would like 4 graphs made.
Data attached
Please deliver these graphs & the calculated data in Excel xlsx format
All as 2D column graphs
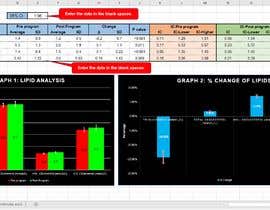
GRAPH 1: Lipids
Please calculate the 95% CI, plot mean pre program & post program results and 95%CI
2D column graph
GRAPH 2: Lipids % change
Calculate & plot the mean % change in each lipid with appropriate 95% CI on error bars
GRAPH 3: Liver Function
Liver function pre & post intervention with 95% CI on error bars
GRAPH 4: Live function % change
Calculate & plot the & change in liver function & 95%CI on error bars
Anbefalede færdigheder
Arbejdsgiverfeedback
“Great work, quick, answered all questions”
![]() AmySzabo, Australia.
AmySzabo, Australia.
Offentlig Præciserings Opslagstavle
Sådan kommer du i gang med konkurrencer
-

Opret din konkurrence Hurtigt og nemt
-

Få tonsvis af indlæg Fra hele verden
-

Tildel det bedste indlæg Download filerne - Nemt!